
Graph My Center
Math: Statistics: Data Analysis
Math: Statistics: Displaying and Describing Univariate Data
9-12
45 Minutes
TI Connect™ CE
TI-84 series
Lessons
Graph My Center
Activity Overview
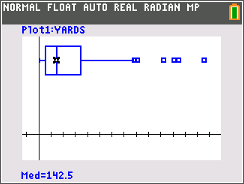
Students create a box plot or histogram. They will find measures of central tendency and identify which best describes the data set.
Download Files
Teacher Files
Math: Statistics: Data Analysis
Math: Statistics: Displaying and Describing Univariate Data
9-12
45 Minutes
TI Connect™ CE
TI-84 series
Lessons
iPad is a trademark of Apple Inc., registered in the U.S. and other countries.
Vernier EasyData,Vernier EasyLink and Vernier EasyTemp are registered trademarks of Vernier Science Education.
Vernier EasyData,Vernier EasyLink and Vernier EasyTemp are registered trademarks of Vernier Science Education.