
Barometric Pressure - Simulated Data Analysis
Science: Earth Science: Earth's Atmosphere
6-8
45 Minutes
TI-Nspire™ CX series
TI-Nspire™ CX CAS/CX II CAS
TI-Nspire™ Apps for iPad®
3.9
Lessons
Data Collection
Simulations
TNS
Barometric Pressure - Simulated Data Analysis
Activity Overview
In this lesson, students will use a simulation to collect data points through Hurricane Katrina, save the data in a spreadsheet and then analyze the data.
Objectives
- Students will examine changes in barometric pressure during a hurricane.
- Students will examine the relationship between barometric pressure and distance from the eye of the hurricane.
Vocabulary
- barometric pressure
- low pressure
- high pressure
About the Lesson
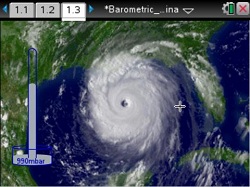
This lesson is a simulation of barometric pressure measured across different points in relation to Hurricane Katrina. This provides an opportunity for students to gather data and explore parts of a hurricane and how barometric pressure changes in relation to the hurricane.
As a result, students will:
- Measure the distance of the eye of Hurricane Katrina from the coast and measure the diameter of the hurricane.
- Collect data on barometric pressure across different points of an aerial view of Hurricane Katrina.
- Use collected data to classify Hurricane Katrina on the Saffir/Simpson Hurricane Scale.
Download Files
Science: Earth Science: Earth's Atmosphere
6-8
45 Minutes
TI-Nspire™ CX series
TI-Nspire™ CX CAS/CX II CAS
TI-Nspire™ Apps for iPad®
3.9
Lessons
Data Collection
Simulations
TNS
iPad is a trademark of Apple Inc., registered in the U.S. and other countries.
Vernier EasyData,Vernier EasyLink and Vernier EasyTemp are registered trademarks of Vernier Science Education.
Vernier EasyData,Vernier EasyLink and Vernier EasyTemp are registered trademarks of Vernier Science Education.