You can collect and graph data in Python programs from Vernier Go Direct® sensors through the TI Bluetooth® Adapter (with Sketch v1.1.1 or later).
Note: This functionality is not available for sensors connected directly over USB.
Setting up Python to use Go Direct data
| 1. | Download and install the Python module for the Go Direct sensors from the resource page on the Texas Instruments Education website. |
The module supports three ways to collect the sensor data:
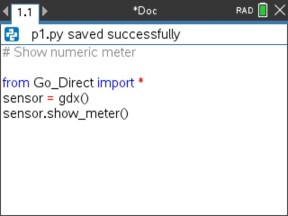
| • | Meter mode – Numeric display of the data. |
| • | Graph mode – Graphical display of the data (that can be customized if needed). |
| • | Events with entry – Collect the data based on specific user actions. |
Each option can be used independently.
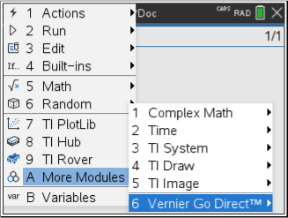
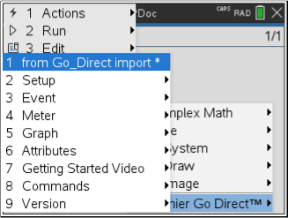
After the module is installed, you will see a new item on the More Modules menu in the Python editor with the available functionality.
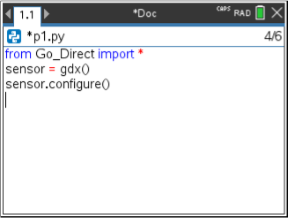
| 2. | Pair a Go Direct sensor with the TI Bluetooth® Adapter. |
Turn the sensor on and use the configure() function to find and pair the sensor with the adapter. Use the ID that is printed on the sensor when prompted to enter the sensor ID.
When the pairing process completes, the TI Bluetooth® Adapter will store the ID of the connected sensor and that configuration is available for use without re-configuration. This allows the same sensor-adapter pair to be re-used multiple times in different experiments.
| 3. | Collect and display data from the Python program using one of the following data collection methods. |
Meter View
Graph View
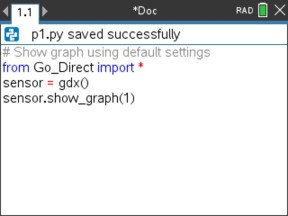
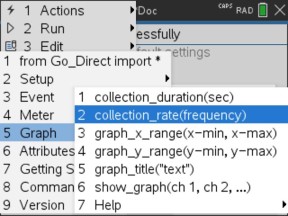
The graph settings are set to defaults that display the sensor name and the default range. You can change the title, range, and sample rate using the functions in the module.
The collected data is also stored in lists for additional analysis using the Lists and Spreadsheets application.