Data Collection
The Vernier DataQuest™ application is built into the TI-Nspire™ software and the operating system (OS) for handhelds. The application lets you:
|
•
|
Capture, view, and analyze real-world data using a TI-Nspire™ CX II handheld, a Windows® computer, or a Mac® computer. |
|
•
|
Collect data from up to four Bluetooth connected Vernier Go Direct® sensors using a TI Bluetooth® Adapter. |
|
•
|
Collect data from up to five connected sensors (three analog and two digital) using the TI-Nspire™ Lab Cradle. |
Important: The TI-Nspire™ CM-C Handheld is not compatible with the Lab Cradle and only supports the use of a single sensor at a time.
|
•
|
Collect data either in the classroom or at remote locations using collection modes such as time-based or event-based. |
|
•
|
Collect several data runs for comparison. |
|
•
|
Create a graphical hypothesis using the Draw Prediction feature. |
|
•
|
Play back the data set to compare the outcome to the hypothesis. |
|
•
|
Analyze data using functions such as interpolation, tangential rate, or modeling. |
|
•
|
Send collected data to other TI-Nspire™ applications. |
|
•
|
Access sensor data from all connected sensor probes through your TI-Basic program. |
Adding a Vernier DataQuest™ Page
Note: The application is launched automatically when you connect a sensor.
Starting a new document or problem for each new experiment ensures that the Vernier DataQuest™ application is set to its default values.
|
▶
|
To start a new document containing a data collection page: |
From the main menu, click , and then click .
Handheld: Press c, and select  .
.
|
▶
|
To insert a new problem with a data collection page into an existing document: |
From the toolbar, click .
Handheld: Press ~ and select .
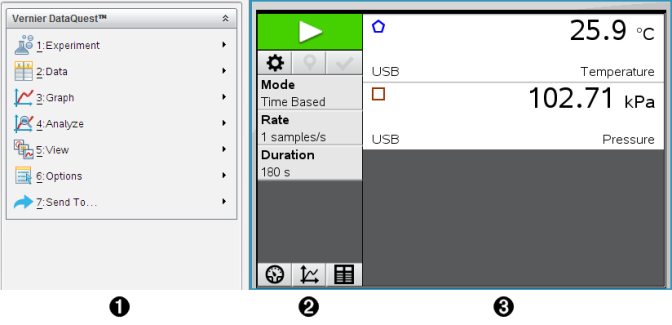
|
À
|
Vernier DataQuest™ Menu. Contains menu items for setup, collection, and analysis of sensor data.
|
|
Á
|
Details view. Contains buttons for starting data collection  , changing collection settings , changing collection settings  , marking collected data , marking collected data  , storing data sets , storing data sets  , and tabs for managing multiple data runs. , and tabs for managing multiple data runs.
View selection buttons let you choose from Meter view  , Graph view , Graph view  , or Table view , or Table view  . .
|
|
Â
|
Data work area. The information displayed here depends on the view.
Meter. Displays a list of sensors that are currently connected or set up in advance.
Graph. Displays collected data in a graphical representation, or displays the prediction before a data collection run.
Table. Displays collected data in columns and rows.
|
Topic Links