The Data & Statistics application provides tools to:
| • | Visualize sets of data in different types of plots. |
| • | Directly manipulate variables to explore and visualize data relationships. Data changes in one application are dynamically applied to all linked applications. |
| • | Explore central tendency and other statistical summary techniques. |
| • | Fit functions to data. |
| • | Create regression lines for scatter plots. |
| • | Graph hypothesis tests and results (z- and t-tests) based on summary statistics definitions or data. |
Adding a Data & Statistics Page
| ▶ | To start a new document with a blank Data & Statistics page: |
From the main File menu, click New Document, and then click Add Data & Statistics.
Handheld: Press c, and select Data & Statistics  .
.
| ▶ | To add a Data & Statistics page in the current problem of an existing document: |
From the toolbar, click Insert > Data & Statistics.
Handheld: Press ~ and select Insert > Data & Statistics.
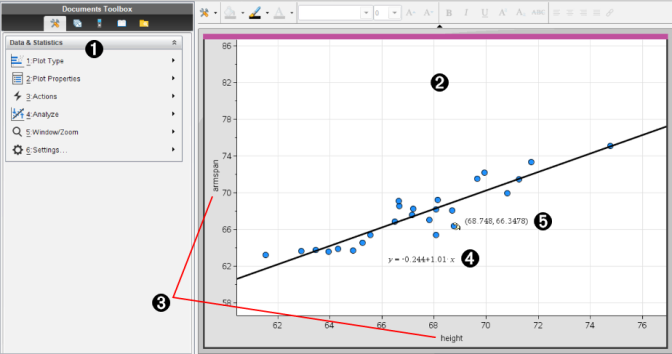
|
À |
Data & Statistics menu |
|
Á |
Work area |
|
 |
Add Variable regions on x-axis and y-axis |
|
à |
Linear Regression Plot with expression |
|
Ä |
Data point with coordinates |