Education Technology

Statistics and Probability / Two Way Tables and Categorical Data

Grade Level 7,8
Activity 24 of 24
In this lesson, students will use two-way tables to investigate associations between two categorical variables.

Planning and Resources

Objectives
Students recognize whether there is an association between categorical data using two-way tables and stacked bar graphs. They also determine conditional probabilities given information in a two-way table.

Vocabulary
two-way table
categorical data
relative frequency
conditional probability


Standard: Search Standards Alignment

Downloads

Lesson Snapshot

Understanding

Conditional probabilities and/or stacked bar graphs can reveal potential associations among categorical variables.

What to look for

Relative frequency is particularly important when comparing groups of different sample size.

Sample Assessment

The table below describes risk factors for obesity associated with age.

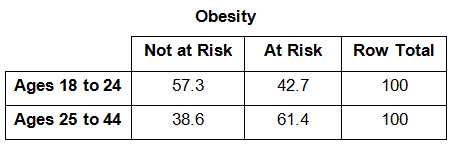
a) What do these number represent? Are they frequencies or relative frequencies or neither?

Answer: These numbers represent relative frequencies, but they are presented as percentages between 0 and 100 rather than as decimal numbers between 0 and 1.


b) Does there appear to be an association between age group and obesity risk?

Answer: There does appear to be ans association. The older group has a much higher percentage at risk than the younger group.

The Big Idea

Two-way tables of relative frequencies provide numerical evidence for whether or not there is an association between categorical variables, and the associated relative frequency graphs provide visual evidence.

What are the students doing?

Students explore two-way tables and stacked bar graphs as tools for investigating whether or not there is an association between two categorical variables.

What is the teacher doing?

Be sure students understand that the relative frequency graphs are particularly important when comparing categories where the total counts are different.