Education Technology

Statistics and Probability / Modeling Linear Relationships

Grade Level 8
Activity 23 of 24
In this lesson, students investigate patterns of association in bivariate data looking for direction, strength, and form of the relationship between the two variables.

Planning and Resources

Objectives
Students identify an association between two quantitative variables as strong or weak, positive or negative, and interpret the association in context. They model relationships between two quantitative variables with linear equations and assess the fit of the model using the sum of the absolute value of the deviations.

Vocabulary
association
linear
regression
rate of change
residual


Standard: Search Standards Alignment

Downloads

Lesson Snapshot

Understanding

A model that "fits" the data well minimizes the sum of the absolute deviations from line.

What to look for

To analyze how well a linear equation "fits" the data, construct a scatter plot of the residuals for any patterns or predictability. Models that result in a pattern in the residual plot do not model the data well.

Sample Assessment

The scatter plot below shows the relationship between height, in centimeters, and the arm span, in centimeters, of 15 students in a class.

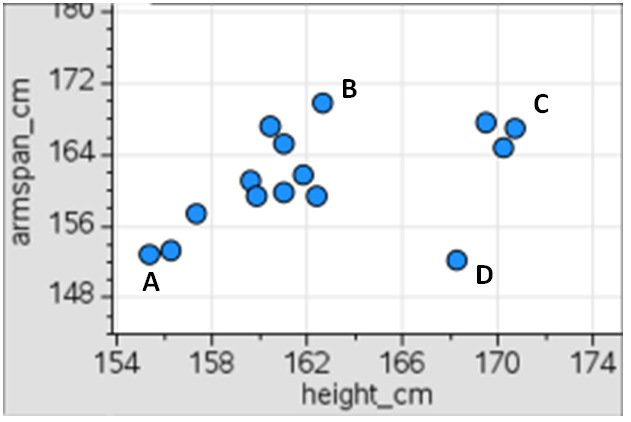
Based on the scatter plot, determine which ordered pair would be the farthest from the best fit line.

a) A
b) B
c) C
d) D

Answer: D

The Big Idea

Linear equations can be used to model the relationship between two variables whose scatter plot shows a linear pattern.

What are the students doing?

Students use linear equations to model the relationship between two variables whose scatter plot reveals a linear pattern. Students assess the fit of their model using the sum of the absolute values of the errors between observed and predicted values.

What is the teacher doing?

Make sure students understand the "error" as the difference between the observed value for a given input and the value predicted by the line.