Education Technology
Grade Level 6,8
Activity 22 of 24
In this lesson, students will investigate scatter plots of paired variables. Students practice interpreting points in context and look for overall trends among the data.

Planning and Resources

Objectives
Students interpret points represented in a scatter plot in terms of the context of the variables. They describe trends in a scatter plot and identify possible associations among variables. Students identify and interpret clusters, gaps, and unusual points in a scatter plot.

Vocabulary
scatter plot
association
response variable


Standard: Search Standards Alignment

Downloads

Lesson Snapshot

Understanding

Scatter plots reveal possible associations between paired observations.

What to look for

Students can highlight the locations of subgroups of the population within the scatter plot to understand how they compare with regard to one or both of the variables in a scatter plot.

Sample Assessment

A scatter plot of paired measurement variables can often be described in terms of clusters, gaps, and unusual data points.

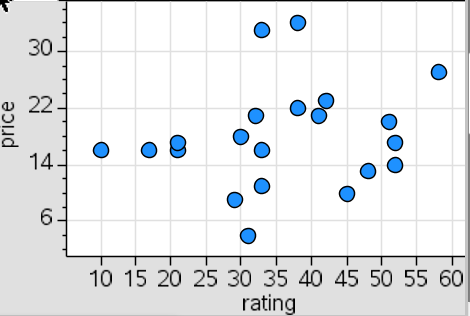
a) Estimate the highest rating for any of the brands.
Answer: 57 or 58

b) Would you buy the brand represented by (31, 4) or the one by (32, 34)? Explain your answer.
Answer: The two brands have almost the same rating but one costs $4 and the other $34, so I would buy the cheaper one.

c) If you were willing to pay about $15 for the tool, what brand would you look for?
Answer: a brand with rating greater than 50

The Big Idea

A scatter plot of paired measurement variables can often be described in terms of clusters, gaps, and unusual data points.

What are the students doing?

Students use scatter plots to reveal information about the relationships among paired observations.

What is the teacher doing?

Make sure students confront the tendency to think of scatter plots in terms of individual points, and direct them to make general statements of overall trends.