
Introduction to the Fundamental Theorem
Math: Calculus: Fundamental Theorem
Math: AP Calculus: AP Calculus
9-12
45 Minutes
TI-89 / TI-89 Titanium
Lessons
Introduction to the Fundamental Theorem
Activity Overview
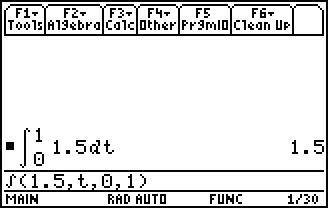
This activity builds student comprehension of functions defined by a definite integral, where the independent variable is an upper limit of integration.
Download Files
Teacher Files
Student Files
Math: Calculus: Fundamental Theorem
Math: AP Calculus: AP Calculus
9-12
45 Minutes
TI-89 / TI-89 Titanium
Lessons
iPad is a trademark of Apple Inc., registered in the U.S. and other countries.
Vernier EasyData,Vernier EasyLink and Vernier EasyTemp are registered trademarks of Vernier Science Education.
Vernier EasyData,Vernier EasyLink and Vernier EasyTemp are registered trademarks of Vernier Science Education.