
"Value"able Theorems
Math: Calculus: Derivatives
Math: Calculus: Other Functions
Math: AP Calculus: AP Calculus
9-12
15 Minutes
TI-89 / TI-89 Titanium
Lessons
"Value"able Theorems
Activity Overview
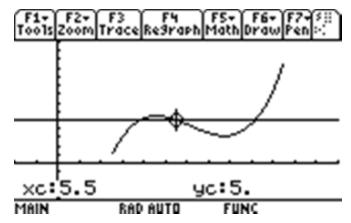
Students are introduced to the Intermediate Value Theorem and Extreme Value Theorem from a graphical perspective.
Download Files
Teacher Files
Student Files
Math: Calculus: Derivatives
Math: Calculus: Other Functions
Math: AP Calculus: AP Calculus
9-12
15 Minutes
TI-89 / TI-89 Titanium
Lessons
iPad is a trademark of Apple Inc., registered in the U.S. and other countries.
Vernier EasyData,Vernier EasyLink and Vernier EasyTemp are registered trademarks of Vernier Science Education.
Vernier EasyData,Vernier EasyLink and Vernier EasyTemp are registered trademarks of Vernier Science Education.