Chi-Square Distributions

Math: Statistics: Statistical Inference
9-12
30 Minutes
TI-Nspire™ CX series
TI-Nspire™ CX CAS/CX II CAS
3.2
Lessons
TNS
Chi-Square Distributions
Activity Overview
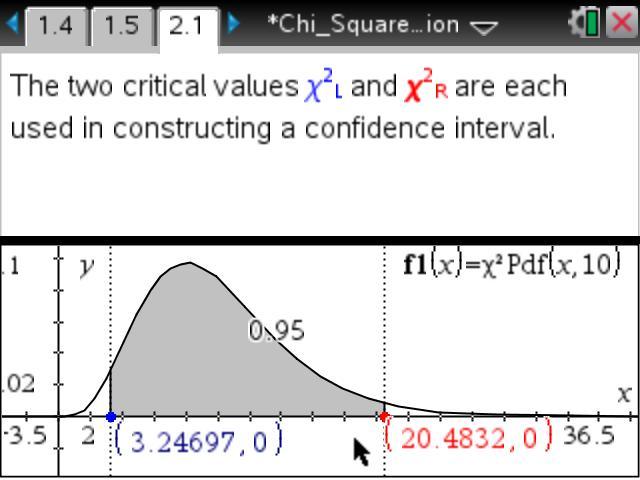
Students compare the Chi-Square distribution to the standard normal distribution and determine how the Chi-Square distribution changes as they increase the degrees of freedom.
Download Files
Teacher Files
Student Files
Math: Statistics: Statistical Inference
9-12
30 Minutes
TI-Nspire™ CX series
TI-Nspire™ CX CAS/CX II CAS
3.2
Lessons
TNS
iPad is a trademark of Apple Inc., registered in the U.S. and other countries.
Vernier EasyData,Vernier EasyLink and Vernier EasyTemp are registered trademarks of Vernier Science Education.
Vernier EasyData,Vernier EasyLink and Vernier EasyTemp are registered trademarks of Vernier Science Education.

