
Hypothesis Testing: Means
Math: Statistics: Inferential Statistics
9-12
40 Minutes
TI-Nspire™ CX series
1.7
Lessons
TNS
Hypothesis Testing: Means
Activity Overview
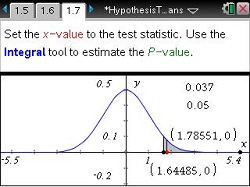
Students test a claim about a mean with a large sample size using the test statistic and the critical value. They also find the area under the curve to find the p value. Then, students will see how the result would change if they used a one-percent significance level or smaller sample size. An optional extension further allows students to study the importance of sample size.
Download Files
Teacher Files
Student Files
Math: Statistics: Inferential Statistics
9-12
40 Minutes
TI-Nspire™ CX series
1.7
Lessons
TNS
iPad is a trademark of Apple Inc., registered in the U.S. and other countries.
Vernier EasyData,Vernier EasyLink and Vernier EasyTemp are registered trademarks of Vernier Science Education.
Vernier EasyData,Vernier EasyLink and Vernier EasyTemp are registered trademarks of Vernier Science Education.