
Transformations With Lists
Math: Geometry: Transformational Geometry
9-12
45 Minutes
TI-84 series
Lessons
Transformations With Lists
Activity Overview
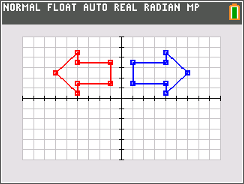
Students use list operations to perform reflections, rotations, translations and dilations on a figure, and graph the resulting image using a scatter plot.
Download Files
Teacher Files
Student Files
Math: Geometry: Transformational Geometry
9-12
45 Minutes
TI-84 series
Lessons
iPad is a trademark of Apple Inc., registered in the U.S. and other countries.
Vernier EasyData,Vernier EasyLink and Vernier EasyTemp are registered trademarks of Vernier Science Education.
Vernier EasyData,Vernier EasyLink and Vernier EasyTemp are registered trademarks of Vernier Science Education.