
t Distributions
Math: Statistics: Displaying and Describing Univariate Data
Math: Statistics: Normal Distributions
9-12
40 Minutes
TI-84 series
Lessons
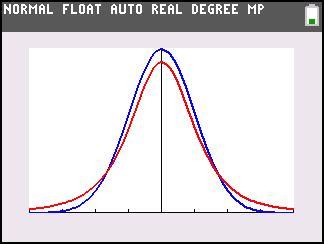
t Distributions
Activity Overview
Students compare the t distribution to the standard normal distribution and use the invT command to find critical values for a t distribution.
Download Files
Teacher Files
Student Files
Math: Statistics: Displaying and Describing Univariate Data
Math: Statistics: Normal Distributions
9-12
40 Minutes
TI-84 series
Lessons
iPad is a trademark of Apple Inc., registered in the U.S. and other countries.
Vernier EasyData,Vernier EasyLink and Vernier EasyTemp are registered trademarks of Vernier Science Education.
Vernier EasyData,Vernier EasyLink and Vernier EasyTemp are registered trademarks of Vernier Science Education.