Education Technology
Grade Level 6,7
Activity 3 of 24
In this lesson, students will construct box plots from the five-number summary, helping them understand how data is represented and interpreted from a box plot.

Planning and Resources

Objectives
Students should understand the relationship between a dot plot and its corresponding box plot. They recognize that the sizes of the four intervals determined by the box plot reflect the spread of the data values and that each  interval contains approximately 14 of the data.

Vocabulary
median
upper quartile
lower quartile
minimum
maximum
interquartile range (IQR)
box plot


Standard: Search Standards Alignment

Downloads

Lesson Snapshot

Understanding

It is important to make the relationship between dot plots and their corresponding box plots explicit: i.e., 1) a summary as represented in a box plot will not show gaps and clusters and 2) very different distributions can have the same box plot.

What to look for

Help students realize that the number of data values in any of the four intervals in the box plot is approximately 14 of all of the values and the spread of the data values in any one interval is reflected in the size of the IQR.

Sample Assessment

The plot below shows the results of a survey of households about the number of dogs in the household. Identify the following statements as true or false. Explain your reasoning in each case.

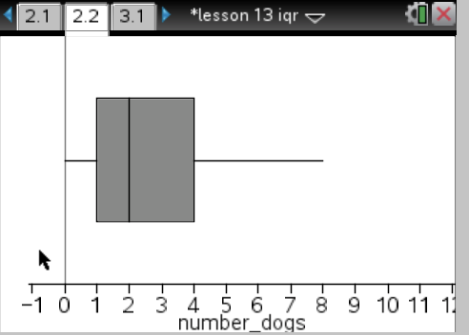
a. The maximum number of dogs in any house is 8.
b. At least (1/2) of the houses have 2 or more dogs.
c. Every house in the survey had at least 1 dog.
d. Half of the houses surveyed have between 1 and 4 dogs.

Answer:
a. True, because the segment at the top goes to 8.
b. True, because 2 is the median.
c. False, because the lower segment starts at 0 so at least one household does not have a dog as a pet.
d. True, because the interval between the LQ and UQ goes from 1 to 4 and that marks off the middle half of the data.

The Big Idea

The three intervals, minimum to LQ, LQ to UQ, and UQ to maximum, contain approximately 14, 12, and 14 of the data values, respectively.

What are the students doing?

 Ask questions such as, “How can you adjust the data so that the median is now 80?” Have students work with a partner to explore changing the data in order to get a specific result.

What is the teacher doing?

Help students make the connection between the median and the interquartile range on the number line and on the box plot. Encourage students to move the dots on the number line so that the median in the box plot changes.