
Normal Probability Plot
Math: Statistics: Normal Distributions
9-12
45 Minutes
TI-Nspire™ CX series
TI-Nspire™ CX CAS/CX II CAS
3.0
Lessons
TNS
Normal Probability Plot
Activity Overview
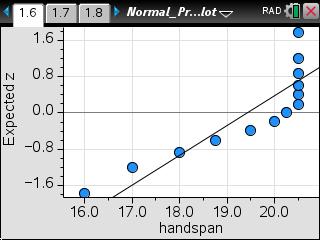
This lesson involves creating a normal probability plot for several data sets involving height to examine the appearance of such plots when the distribution is approximately normal.
Objectives
- Students will identify the shape of a distribution as being skewed or mound-shaped and approximately symmetric.
- Students will recognize that a normal probability plot of skewed data is nonlinear and either concave up or concave down.
- Students will recognize that a normal probability plot of approximately normal data is approximately linear.
- Students will identify outliers on a normal probability plot.
Vocabulary
- normal
- normal probability plot
- outlier
- skew
- symmetric
About the Lesson
This lesson involves creating a normal probability plot for several data sets involving height to examine the appearance of such plots when the distribution is approximately normal.
As a result, students will:
- Use a histogram to discuss the shape of the distribution of a data set.
- Describe a normal probability plot for data sets whose distributions are skewed, approximately normal, or contain outliers.
- Move data values in a dot plot to investigate how the shape of a distribution compares to the linearity of a normal probability plot.
Math: Statistics: Normal Distributions
9-12
45 Minutes
TI-Nspire™ CX series
TI-Nspire™ CX CAS/CX II CAS
3.0
Lessons
TNS
iPad is a trademark of Apple Inc., registered in the U.S. and other countries.
Vernier EasyData,Vernier EasyLink and Vernier EasyTemp are registered trademarks of Vernier Science Education.
Vernier EasyData,Vernier EasyLink and Vernier EasyTemp are registered trademarks of Vernier Science Education.