
Square it Up!
Math: Statistics: Describing Bivariate Data
9-12
15 Minutes
TI-84 series
Lessons
Square it Up!
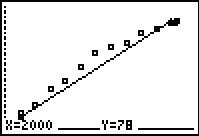
Activity Overview
Students investigate the method of least squares by finding the residuals and the sum of the squares of the residuals.
Download Files
Teacher Files
Student Files
Math: Statistics: Describing Bivariate Data
9-12
15 Minutes
TI-84 series
Lessons
iPad is a trademark of Apple Inc., registered in the U.S. and other countries.
Vernier EasyData,Vernier EasyLink and Vernier EasyTemp are registered trademarks of Vernier Science Education.
Vernier EasyData,Vernier EasyLink and Vernier EasyTemp are registered trademarks of Vernier Science Education.