SD: How Far is Typical?

SD: How Far is Typical?
This lesson involves gaining a basic understanding of what standard deviation is measuring by examining the location of data around the mean.
- Students will identify the standard deviation as a measure of spread about the mean of a distribution and loosely interpret it as an "average" or typical distance from the mean.
- deviation
- dotplot
- mean
- range
- residual
- standard deviation
This lesson involves gaining a basic understanding of what standard deviation is measuring by examining the location of data around the mean.
As a result, students will:
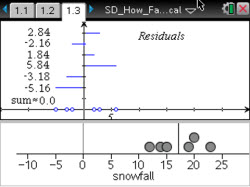
- Find the sum of the residuals to be 0 and consider both squaring and absolute value to eliminate the negative values.
- Compare the standard deviation to the mean of the absolute values of the residuals as the data changes.
- Change the amount of snowfall by moving data points and comparing the squared standard deviation and the mean of the squared residuals in the plots.
Vernier EasyData,Vernier EasyLink and Vernier EasyTemp are registered trademarks of Vernier Science Education.

