Car MPG Activity using Central Tendencies

Math: PreAlgebra: Probability, Statistics and Data Analysis
Math: Algebra I: Data Analysis
6-8
9-12
9-12
30 Minutes
TI-Nspire™ CX series
3.2
Lessons
TNS
Car MPG Activity using Central Tendencies
Activity Overview
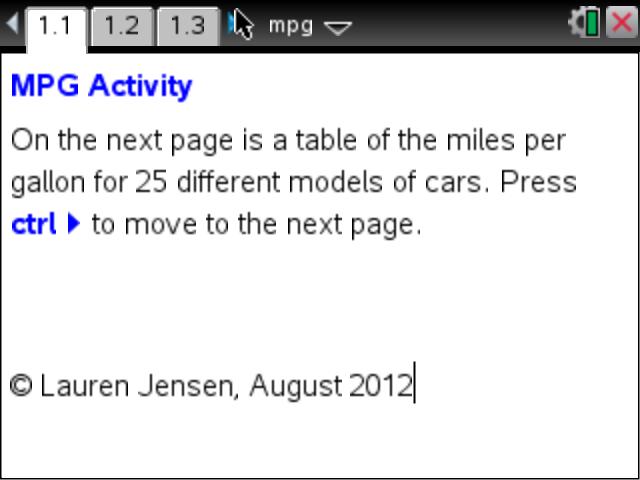
This activity involves students finding the measures of central tendencies using mpg data from 25 cars.
Besides finding the measures of central tendencies, students are also to create a box plot on the Nspire. If you do not know how to do this, instruct the students to press menu>plot type>box plot. (The directions are not provided in the worksheet.) The box and whiskers handout is also included.
Download Files
Math: PreAlgebra: Probability, Statistics and Data Analysis
Math: Algebra I: Data Analysis
6-8
9-12
9-12
30 Minutes
TI-Nspire™ CX series
3.2
Lessons
TNS
iPad is a trademark of Apple Inc., registered in the U.S. and other countries.
Vernier EasyData,Vernier EasyLink and Vernier EasyTemp are registered trademarks of Vernier Science Education.
Vernier EasyData,Vernier EasyLink and Vernier EasyTemp are registered trademarks of Vernier Science Education.

