
A Little Light Work
Science: Physical Science: Energy
Science: Physics: Light and Optics
9-12
45 Minutes
1.7
- pen or pencil
By Russell Brown
Lessons
TNS
A Little Light Work
Activity Overview
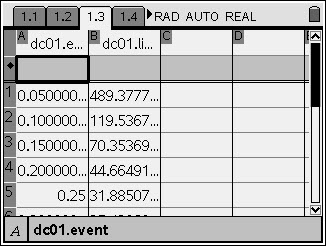
Students will study graphs of light intensity at various distances from a light sensor. They will use power and linear regressions to determine the relationship between light intensity and distance from the light source. They will also develop their own models for the relationship.
Download Files
Teacher Files
Student Files
Science: Physical Science: Energy
Science: Physics: Light and Optics
9-12
45 Minutes
1.7
- pen or pencil
By Russell Brown
Lessons
TNS
iPad is a trademark of Apple Inc., registered in the U.S. and other countries.
Vernier EasyData,Vernier EasyLink and Vernier EasyTemp are registered trademarks of Vernier Science Education.
Vernier EasyData,Vernier EasyLink and Vernier EasyTemp are registered trademarks of Vernier Science Education.