
What’s Normal, Anyway?
What’s Normal, Anyway?
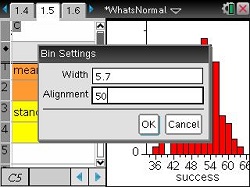
In this activity, students explore the normal distribution and several of its most interesting properties. First, they use a histogram of data from a binomial experiment to examine the general shape of a normal curve. Then, they use a dynamic illustration to make observations, using sliders to change the mean and standard deviation. Lastly, they examine the empirical rule for normal distributions, describing the percent of data values falling within different standard deviations from the mean.
Download the attached PDF and look over the information on the first page. Download and distribute the attached TI-Nspire document (.tns file) for use during the activity. A TI-Nspire document (.tns file) containing expected student results is also available for download.
Discuss the material from the activity pages with students as needed.
Encourage students to summarize what they have learned from completing the activity.
Before the Activity Files
After the Activity Files
Vernier EasyData,Vernier EasyLink and Vernier EasyTemp are registered trademarks of Vernier Science Education.