
Double Tree
Math: Algebra I: Sequences and Series
9-12
30 Minutes
TI-84 series
Lessons
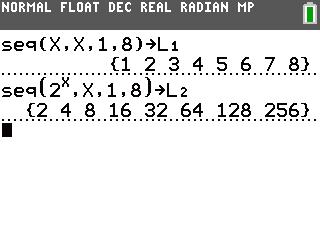
Double Tree
Activity Overview
Students visually explore geometric sequences by modeling the growth of a tree that doubles in height every year.
Download Files
Teacher Files
Student Files
Math: Algebra I: Sequences and Series
9-12
30 Minutes
TI-84 series
Lessons
iPad is a trademark of Apple Inc., registered in the U.S. and other countries.
Vernier EasyData,Vernier EasyLink and Vernier EasyTemp are registered trademarks of Vernier Science Education.
Vernier EasyData,Vernier EasyLink and Vernier EasyTemp are registered trademarks of Vernier Science Education.