
Limacon Curve
Math: Precalculus: Polar Equations
Math: AP Precalculus: Trigonometric and Polar Functions
9-12
50 Minutes
TI-Nspire™ CX series
5.4
Lessons
TNS
Limacon Curve
Activity Overview
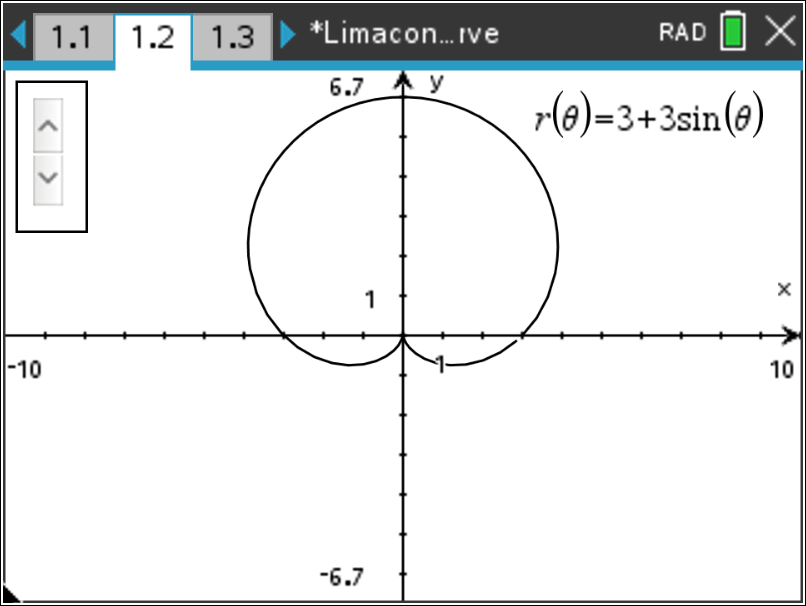
In this activity, students will observe different graphs of polar limaçon curves. Students will discover four different types of limaçon curves and their relationship to the ratio of a to b.
About the Lesson
In this activity, students begin by exploring limaçon graphs in the form r = a ± b sin(q) or r = a ± b cos(q). Students will view several cardioids to see the effects of a and b on the graphs. Students will also explore what effects addition and subtraction have on the graph, as well as sine versus cosine.
For students preparing for the AP Precalculus exam, an optional "AP Practice Questions" document is available for download.
Download Files
Math: Precalculus: Polar Equations
Math: AP Precalculus: Trigonometric and Polar Functions
9-12
50 Minutes
TI-Nspire™ CX series
5.4
Lessons
TNS
iPad is a trademark of Apple Inc., registered in the U.S. and other countries.
Vernier EasyData,Vernier EasyLink and Vernier EasyTemp are registered trademarks of Vernier Science Education.
Vernier EasyData,Vernier EasyLink and Vernier EasyTemp are registered trademarks of Vernier Science Education.