
Modeling Probabilities
Math: AP Precalculus: AP Precalculus
9-12
60 Minutes
TI-Nspire™ CX series
3.2
Lessons
TNS
Modeling Probabilities
Activity Overview
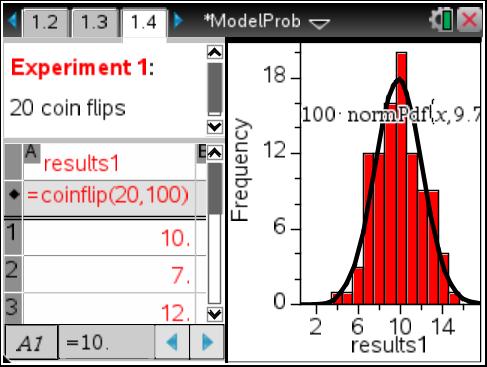
This activity approaches probability distributions as functions taking information about a dataset as inputs and outputting a set of probabilities. This is analogous to the familiar process of choosing a function to model a set of x-y pairs. Students use simulations to explore increasing number of trials. The normal distribution is introduced, compared with the binomial distribution, and applied.
Download Files
Teacher Files
Student Files
Math: AP Precalculus: AP Precalculus
9-12
60 Minutes
TI-Nspire™ CX series
3.2
Lessons
TNS
iPad is a trademark of Apple Inc., registered in the U.S. and other countries.
Vernier EasyData,Vernier EasyLink and Vernier EasyTemp are registered trademarks of Vernier Science Education.
Vernier EasyData,Vernier EasyLink and Vernier EasyTemp are registered trademarks of Vernier Science Education.