
Transforming Relationships
Math: Statistics: Data Analysis
Math: Statistics: Describing Bivariate Data
9-12
40 Minutes
TI-Nspire™ CX series
TI-Nspire™ CX CAS/CX II CAS
3.2
Lessons
TNS
Transforming Relationships
Activity Overview
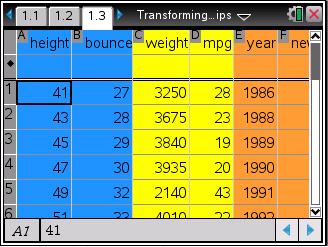
In this activity, students will assess the strength of a linear relationship using a residual plot. They will also calculate the correlation coefficient and coefficient of determination to assess the data set. Students will then learn to transform one or two variables in the relationship to create a linear relationship.
Download Files
Teacher Files
Student Files
Math: Statistics: Data Analysis
Math: Statistics: Describing Bivariate Data
9-12
40 Minutes
TI-Nspire™ CX series
TI-Nspire™ CX CAS/CX II CAS
3.2
Lessons
TNS
iPad is a trademark of Apple Inc., registered in the U.S. and other countries.
Vernier EasyData,Vernier EasyLink and Vernier EasyTemp are registered trademarks of Vernier Science Education.
Vernier EasyData,Vernier EasyLink and Vernier EasyTemp are registered trademarks of Vernier Science Education.