
Best Class
Math: Statistics: Data Analysis
Math: Statistics: Displaying and Describing Univariate Data
Math: IB: Analysis-Approaches
Math: IB: Applications-Interpretations
9-12
40 Minutes
TI-84 series
Lessons
Best Class
Activity Overview
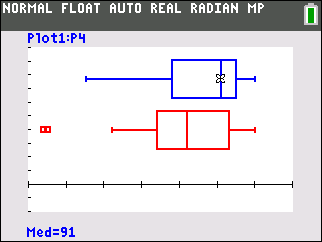
Students will create and explore a box plot and histogram for a data set. They then compare the two data displays by viewing them together and use the comparison to draw conclusions about the data.
Students will represent real-world data using a histogram and box plot and calculate measures of central tendency and spread.
*Note: This activity includes optional IB support, including an IB Questions download for students who are preparing for the IB Exam.
Download Files
Teacher Files
Student Files
Math: Statistics: Data Analysis
Math: Statistics: Displaying and Describing Univariate Data
Math: IB: Analysis-Approaches
Math: IB: Applications-Interpretations
9-12
40 Minutes
TI-84 series
Lessons
iPad is a trademark of Apple Inc., registered in the U.S. and other countries.
Vernier EasyData,Vernier EasyLink and Vernier EasyTemp are registered trademarks of Vernier Science Education.
Vernier EasyData,Vernier EasyLink and Vernier EasyTemp are registered trademarks of Vernier Science Education.