Connecting Algebra 2 to Statistics

Connecting Algebra 2 to Statistics
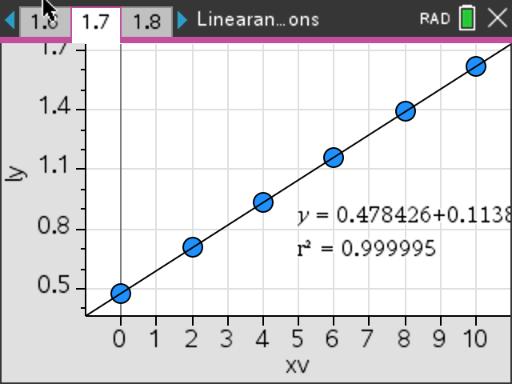
Once students learn how to solve exponential and logarithmic equations, the students can take data and decide if an appropriate model is exponential. This activity will require students to create scatterplots and to have the knowlegde of the relationship being linear or nonlinear. This activity takes about 90 minutes if the tns.document has not been preloaded on the students' handhelds.
The teacher can send the TI-Nspire document from handheld to handheld or use the connect to class software. There is also a solutions document.
Before beginning this activity, make sure you have fully completed it on your own. This activity connects the topic of "Transforming Data to Achieve Linearity" taught in AP Statistics to what students have just learned in Algebra 2. Great for an Honors Algebra 2 class.
After the students have worked through Problem 1, Problems 2 and 3 can be done independently, in pairs during class if time is left, or as homework.
Before the Activity Files
During the Activity Files
After the Activity Files
Vernier EasyData,Vernier EasyLink and Vernier EasyTemp are registered trademarks of Vernier Science Education.

