Education Technology
Grade Level 6,7,8
Activity 1 of 24
The lesson helps students develop a sense of the distribution of data, the number of times each possible outcome occurs.

Planning and Resources

Objectives
Students should understand the idea of a distribution of a set of data.   They can identify clusters, peaks, and gaps, and recognize common shapes in graphical representations of data (skewed, symmetric, uniform, mound shaped).

Vocabulary
distribution
symmetric
mound shaped
uniform
skewed
range
outlier


Standard: Search Standards Alignment

Downloads

Lesson Snapshot

Understanding

Students are introduced to the notion of a statistical question, a question that anticipates variability in the response. This helps to set the stage for this series of lessons.

What to look for

As students compare data, be sure they use the appropriate vocabulary to describe the distributions.

Sample Assessment

The times it took participants to complete a marathon are shown in the graph below. What is the range of the times?
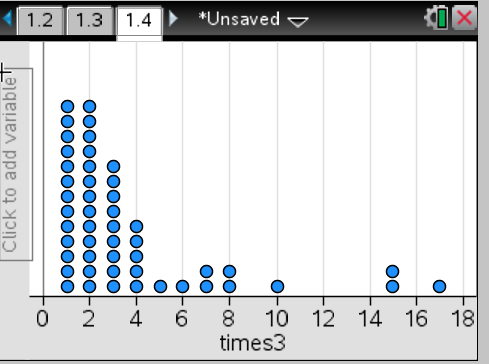
a. 1 to 17 hours
b. 16 hours
c. 17 hours
d. 1 to 2 hours

Answer: b) 16 hours

The Big Idea

A statistical investigation always begins with a statistical question, one where the responses will have variability.

What are the students doing?

Students think about the overall distribution of data as a story about the data as a whole rather than thinking of the data as individual elements.

What is the teacher doing?

Remind students that each dot in the dot plot represents one animal. Explain that these dots are the distribution.