
Comparing Prices
Math: Statistics: Displaying and Describing Univariate Data
9-12
45 Minutes
TI-Nspire™ CX series
TI-Nspire™ CX CAS/CX II CAS
3.2
Lessons
TNS
Comparing Prices
Activity Overview
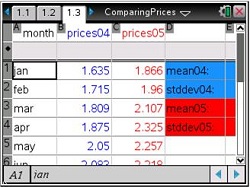
Students will compare average U.S. gasoline prices per gallon for two years. Then they will use the mean and standard deviation (SD) and the median and interquartile range (IQR) to measure the center and spread of price data.
Download Files
Teacher Files
Student Files
Math: Statistics: Displaying and Describing Univariate Data
9-12
45 Minutes
TI-Nspire™ CX series
TI-Nspire™ CX CAS/CX II CAS
3.2
Lessons
TNS
iPad is a trademark of Apple Inc., registered in the U.S. and other countries.
Vernier EasyData,Vernier EasyLink and Vernier EasyTemp are registered trademarks of Vernier Science Education.
Vernier EasyData,Vernier EasyLink and Vernier EasyTemp are registered trademarks of Vernier Science Education.