
Bouncing Ball
Math: Algebra I: Quadratic Functions
Science: Physics: Kinematics
9-12
60 Minutes
TI-84 series
CBR™ 2 motion sensor
Lessons
Bouncing Ball
Activity Overview
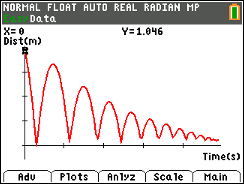
In this activity, students examine the motion of a ball as it falls under the influence of gravity. The parameters in the vertex form of the quadratic
equation Y = A(X - H)2 + K are determined to describe the behavior of a ball bounce.
About the Lesson
This activity examines the motion of a ball as it falls under the influence of gravity. The parameters in the vertex form of the quadratic equation y = a(x – h)2 + k are determined to describe the behavior of a ball bounce. As a result, students will:
- Collect motion data and graph scatter plots.
- Determine the quadratic equation for a ball bounce.
- Determine the value of the coefficient a in the vertex form of a quadratic equation.
- Explore the effect of a on the shape of the graph.
- Interpret the meaning of the value of a in the context of the problem situation as one half of the acceleration due to gravity.
Download Files
Math: Algebra I: Quadratic Functions
Science: Physics: Kinematics
9-12
60 Minutes
TI-84 series
CBR™ 2 motion sensor
Lessons
iPad is a trademark of Apple Inc., registered in the U.S. and other countries.
Vernier EasyData,Vernier EasyLink and Vernier EasyTemp are registered trademarks of Vernier Science Education.
Vernier EasyData,Vernier EasyLink and Vernier EasyTemp are registered trademarks of Vernier Science Education.