
Outbreak!
Science: Biology: Ecology
Science: Life Science: Ecology
9-12
6-8
6-8
60 Minutes
TI-84 series
This is Activity 9 from the EXPLORATIONS Book: Biology with the TI-83 Plus.
Lessons
Outbreak!
Activity Overview
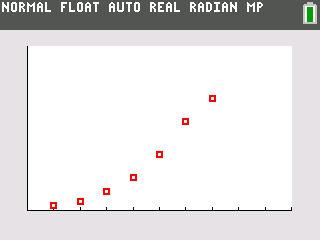
In this activity, students simulate the spread of a virus. They produce a graph representing the spread and analyze the rates of change over time. Students compare how viral and bacterial infections spread in a population.
Download Files
Lesson Files
Science: Biology: Ecology
Science: Life Science: Ecology
9-12
6-8
6-8
60 Minutes
TI-84 series
This is Activity 9 from the EXPLORATIONS Book: Biology with the TI-83 Plus.
Lessons
iPad is a trademark of Apple Inc., registered in the U.S. and other countries.
Vernier EasyData,Vernier EasyLink and Vernier EasyTemp are registered trademarks of Vernier Science Education.
Vernier EasyData,Vernier EasyLink and Vernier EasyTemp are registered trademarks of Vernier Science Education.