
Introduction to Absolute Value
Math: Algebra II: Equations
9-12
45 Minutes
TI-Nspire™ CX series
2.0
Lessons
TNS
Introduction to Absolute Value
Activity Overview
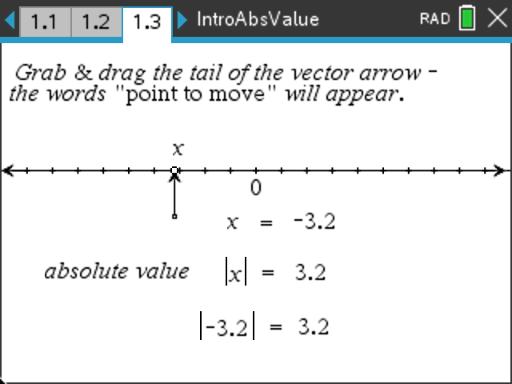
In this activity students will explore the definition of absolute value using a number line, plot points to graph y = |x|, and use sliders to perform transformations with absolute value functions.
Download Files
Teacher Files
Student Files
Math: Algebra II: Equations
9-12
45 Minutes
TI-Nspire™ CX series
2.0
Lessons
TNS
iPad is a trademark of Apple Inc., registered in the U.S. and other countries.
Vernier EasyData,Vernier EasyLink and Vernier EasyTemp are registered trademarks of Vernier Science Education.
Vernier EasyData,Vernier EasyLink and Vernier EasyTemp are registered trademarks of Vernier Science Education.