
Something's Fishy
Science: Biology: Ecology
9-12
60 Minutes
TI-84 series
This is Activity 10 from the EXPLORATIONS Book: Biology with the TI-83 Plus.
Lessons
Something's Fishy
Activity Overview
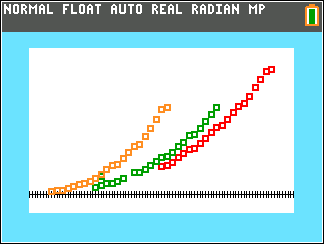
In this activity, students examine the size, mass, and growth rates for three species of fish. They interpolate and extrapolate from best-fit models. Students compare the growth rates of endothermic and exothermic animals.
Download Files
Lesson Files
Science: Biology: Ecology
9-12
60 Minutes
TI-84 series
This is Activity 10 from the EXPLORATIONS Book: Biology with the TI-83 Plus.
Lessons
iPad is a trademark of Apple Inc., registered in the U.S. and other countries.
Vernier EasyData,Vernier EasyLink and Vernier EasyTemp are registered trademarks of Vernier Science Education.
Vernier EasyData,Vernier EasyLink and Vernier EasyTemp are registered trademarks of Vernier Science Education.