
Sound Intensity
Science: Physics: Sound and Waves
9-12
45 Minutes
1.7
- Vernier Sound Level Meter
- loudspeaker and sound generator
- meterstick
- copy of student worksheet
- pen or pencil
- blank sheet of paper
- ear plugs (optional)
By Irina Lyublinskaya
Lessons
TNS
Sound Intensity
Activity Overview
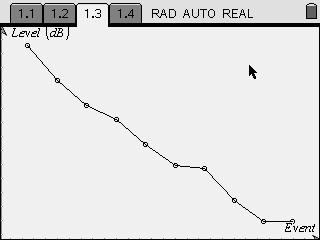
Students investigate the relationship between sound intensity and distance for a commercial loudspeaker. They use collected data to identify a mathematical model for the relationship. They then compare this model with the inverse square law for an ideal point source.
Download Files
Teacher Files
Student Files
Science: Physics: Sound and Waves
9-12
45 Minutes
1.7
- Vernier Sound Level Meter
- loudspeaker and sound generator
- meterstick
- copy of student worksheet
- pen or pencil
- blank sheet of paper
- ear plugs (optional)
By Irina Lyublinskaya
Lessons
TNS
iPad is a trademark of Apple Inc., registered in the U.S. and other countries.
Vernier EasyData,Vernier EasyLink and Vernier EasyTemp are registered trademarks of Vernier Science Education.
Vernier EasyData,Vernier EasyLink and Vernier EasyTemp are registered trademarks of Vernier Science Education.