
Constant of Variation
Math: Algebra II: Rational Expressions
Math: Developmental Mathematics - College: Graphs and Linear Functions
9-12
45 Minutes
TI-Nspire™ CX series
6.2
Lessons
TNS
Constant of Variation
Activity Overview
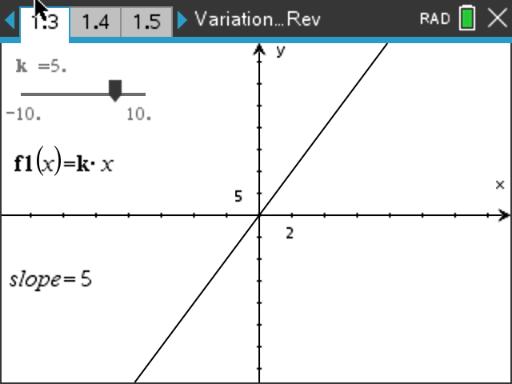
Students explore how the constant of variation, k, affects the graph of direct and inverse variations.
Download Files
Teacher Files
Student Files
Math: Algebra II: Rational Expressions
Math: Developmental Mathematics - College: Graphs and Linear Functions
9-12
45 Minutes
TI-Nspire™ CX series
6.2
Lessons
TNS
iPad is a trademark of Apple Inc., registered in the U.S. and other countries.
Vernier EasyData,Vernier EasyLink and Vernier EasyTemp are registered trademarks of Vernier Science Education.
Vernier EasyData,Vernier EasyLink and Vernier EasyTemp are registered trademarks of Vernier Science Education.