
Testing Claims About Proportions
Math: Statistics: Inferential Statistics
9-12
40 Minutes
TI-Nspire™ CX series
TI-Nspire™ CX CAS/CX II CAS
3.2
By Michele Patrick
Lessons
TNS
Testing Claims About Proportions
Activity Overview
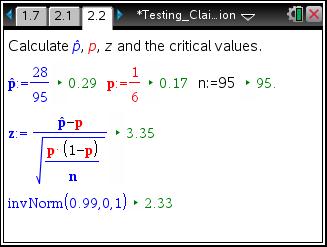
Students find z-scores and critical values to test claims about proportions. To verify the results, they find P-values by either finding the area under the curve with the Integral tool, or by using the 1-Prop z Test command.
Download Files
Teacher Files
Student Files
Math: Statistics: Inferential Statistics
9-12
40 Minutes
TI-Nspire™ CX series
TI-Nspire™ CX CAS/CX II CAS
3.2
By Michele Patrick
Lessons
TNS
iPad is a trademark of Apple Inc., registered in the U.S. and other countries.
Vernier EasyData,Vernier EasyLink and Vernier EasyTemp are registered trademarks of Vernier Science Education.
Vernier EasyData,Vernier EasyLink and Vernier EasyTemp are registered trademarks of Vernier Science Education.