
Box Plots & Histograms
Math: Algebra I: Data Analysis
9-12
30 Minutes
TI-Nspire™ CX series
TI-Nspire™ CX CAS/CX II CAS
3.2
By Lynne Plettenberg
Lessons
TNS
Box Plots & Histograms
Activity Overview
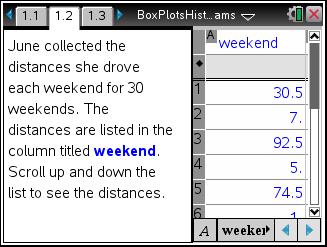
Students create and explore a box plot and histogram for a data set. They then compare the two data displays by viewing them together and use the comparison to draw conclusions about the data.
Download Files
Teacher Files
Student Files
Math: Algebra I: Data Analysis
9-12
30 Minutes
TI-Nspire™ CX series
TI-Nspire™ CX CAS/CX II CAS
3.2
By Lynne Plettenberg
Lessons
TNS
iPad is a trademark of Apple Inc., registered in the U.S. and other countries.
Vernier EasyData,Vernier EasyLink and Vernier EasyTemp are registered trademarks of Vernier Science Education.
Vernier EasyData,Vernier EasyLink and Vernier EasyTemp are registered trademarks of Vernier Science Education.