
Boxplots Introduction
Math: Statistics: Displaying and Describing Univariate Data
Math: Middle Grades Math: Statistics and Probability
9-12
45 Minutes
TI-Nspire™ CX series
TI-Nspire™ CX CAS/CX II CAS
TI-Nspire™ Apps for iPad®
3.9
Lessons
TNS
Boxplots Introduction
Activity Overview
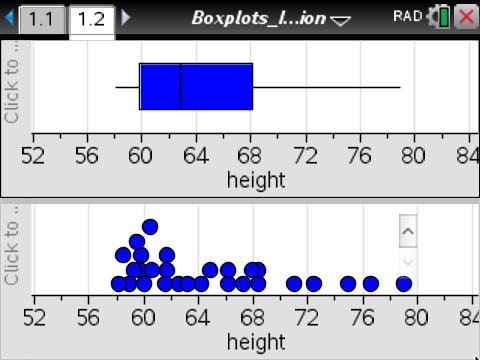
This lesson involves representing distributions of data using boxplots.
Objectives
- Students will describe the overall pattern of a distribution by its shape, center, and spread.
- Students will recognize and identify properties of distributions such as symmetry, skewness, and bimodality from boxplots.
- Students will identify outliers.
- Students will recognize that moving data past a quartile can affect that quartile’s value.
- Students will reason abstractly and quantitatively.
Vocabulary
- boxplot
- interquartile range, IQR
- outlier
- skewness
- interval
- range
- symmetry
- distribution
- median
- quartile
About the Lesson
This lesson involves representing distributions of data using boxplots.
As a result, students will:
- Develop the reasoning skills to recognize properties of a distribution from its boxplot.
- Understand the relationship between individual data values and the five-number summary.
- Move data within a dot plot and observe the changes within the corresponding boxplot to identify particular characteristics that most directly affect the five-number summary.
Download Files
Math: Statistics: Displaying and Describing Univariate Data
Math: Middle Grades Math: Statistics and Probability
9-12
45 Minutes
TI-Nspire™ CX series
TI-Nspire™ CX CAS/CX II CAS
TI-Nspire™ Apps for iPad®
3.9
Lessons
TNS
iPad is a trademark of Apple Inc., registered in the U.S. and other countries.
Vernier EasyData,Vernier EasyLink and Vernier EasyTemp are registered trademarks of Vernier Science Education.
Vernier EasyData,Vernier EasyLink and Vernier EasyTemp are registered trademarks of Vernier Science Education.