
Proportions in Stories
Math: Middle Grades Math: Ratios and Proportional Relationships
6-8
45 Minutes
TI-Nspire™ CX series
TI-Nspire™ CX CAS/CX II CAS
TI-Nspire™ Apps for iPad®
3.6
Proportions in Stories
Activity Overview
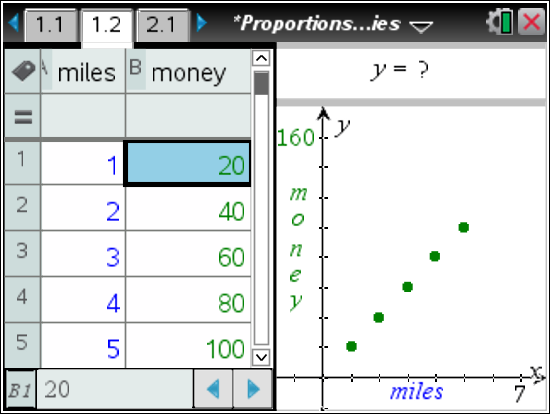
This lesson involves inputting data into a table, observing the data on coordinate plane, and inputting an equation that corresponds with the table of values.
Objectives
- Students will construct a data table, analyze the scatter plot of the data, develop an equation to describe the data, and graph the equation to verify that it represents the data.
- Students will compare and contrast proportional and non-proportional linear relationships in real-life stories represented by a table, an equation, and a graph.
- Students will identify characteristics of proportional relationships by analyzing a table, equation, and graph.
- Students will analyze tables, equations, and graphs to determine if two quantities are in a proportional relationship.
Vocabulary
- proportional
- non-proportional
- slope
- y-intercept
- constant rate of change
- ratio
About the Lesson
This lesson involves inputting data into a table, observing the data on coordinate plane, and inputting an equation that corresponds with the table of values.
As a result, students will:
- Analyze three real-life situations, two that represent proportional relationships and one that represents a non-proportional linear situation.
- Determine characteristics of proportional relationships given in multiple representations, such as verbal, numerical, algebraic, and graphical.
Download Files
Math: Middle Grades Math: Ratios and Proportional Relationships
6-8
45 Minutes
TI-Nspire™ CX series
TI-Nspire™ CX CAS/CX II CAS
TI-Nspire™ Apps for iPad®
3.6
iPad is a trademark of Apple Inc., registered in the U.S. and other countries.
Vernier EasyData,Vernier EasyLink and Vernier EasyTemp are registered trademarks of Vernier Science Education.
Vernier EasyData,Vernier EasyLink and Vernier EasyTemp are registered trademarks of Vernier Science Education.