
Steppin' Out
Science: Physics: Kinematics
9-12
35 Minutes
TI Connect™
TI Connect™ CE
TI Connect™ CE
TI-84 series
- Metric tape measure or meterstick
- Chalk or tape
Lessons
Steppin' Out
Activity Overview
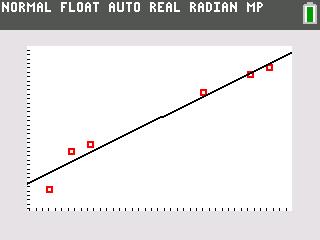
Students will use the Data/Graphs Wizard tool to graph data and determine a line that best fits your data and use the Data/Graphs Wizard tool to identify the relationship between stride length and height.
Download Files
Lesson Files
Science: Physics: Kinematics
9-12
35 Minutes
TI Connect™
TI Connect™ CE
TI Connect™ CE
TI-84 series
- Metric tape measure or meterstick
- Chalk or tape
Lessons
iPad is a trademark of Apple Inc., registered in the U.S. and other countries.
Vernier EasyData,Vernier EasyLink and Vernier EasyTemp are registered trademarks of Vernier Science Education.
Vernier EasyData,Vernier EasyLink and Vernier EasyTemp are registered trademarks of Vernier Science Education.