
What is a p-Value?
Math: Statistics: Hypothesis Tests
9-12
45 Minutes
TI-Nspire™ CX series
TI-Nspire™ CX CAS/CX II CAS
2.1
What is a p-Value?
Activity Overview
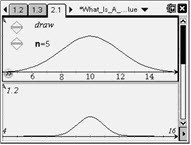
Students begin with a null hypothesis specifying the mean of a normally distributed population with a given standard deviation.
Download Files
Teacher Files
Student Files
Math: Statistics: Hypothesis Tests
9-12
45 Minutes
TI-Nspire™ CX series
TI-Nspire™ CX CAS/CX II CAS
2.1
iPad is a trademark of Apple Inc., registered in the U.S. and other countries.
Vernier EasyData,Vernier EasyLink and Vernier EasyTemp are registered trademarks of Vernier Science Education.
Vernier EasyData,Vernier EasyLink and Vernier EasyTemp are registered trademarks of Vernier Science Education.