
Working Hard or Hardly Working?
Math: Algebra I: Data Analysis
9-12
20 Minutes
TI-Nspire™ CX series
2.0
Lessons
TNS
Working Hard or Hardly Working?
Activity Overview
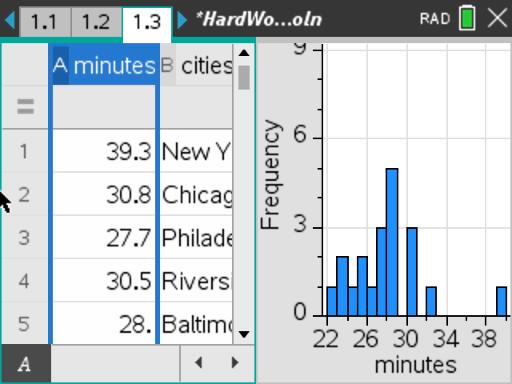
Students analyze univariate and bivariate data. Questions are posed for discussion, further research, and algebraic problem solving.
Download Files
Teacher Files
Student Files
Math: Algebra I: Data Analysis
9-12
20 Minutes
TI-Nspire™ CX series
2.0
Lessons
TNS
iPad is a trademark of Apple Inc., registered in the U.S. and other countries.
Vernier EasyData,Vernier EasyLink and Vernier EasyTemp are registered trademarks of Vernier Science Education.
Vernier EasyData,Vernier EasyLink and Vernier EasyTemp are registered trademarks of Vernier Science Education.