
Forensics Case 12 - Hit and Run: Using information from an event data recorder to reconstruct an ac
Math: Geometry: Points, Lines and Angles
Science: Physical Science: Newton's Laws
Science: Physics: Dynamics
Science: Forensics: Data Analysis
9-12
60 Minutes
TI Connect™
TI-84 series
CBR™ 2 motion sensor
- Toy car
Lessons
Data Collection
Forensics Case 12 - Hit and Run: Using information from an event data recorder to reconstruct an ac
Activity Overview
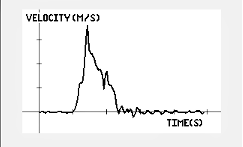
Students learn how distance traveled, velocity, and acceleration are related to one another and how the appearance of an acceleration, velocity, or distance vs. time graph can be used to predict the appearance of the other graphs. They show how accident scenes can be recreated through an analysis of the data that are gathered by an event data recorder (EDR).
Download Files
Math: Geometry: Points, Lines and Angles
Science: Physical Science: Newton's Laws
Science: Physics: Dynamics
Science: Forensics: Data Analysis
9-12
60 Minutes
TI Connect™
TI-84 series
CBR™ 2 motion sensor
- Toy car
Lessons
Data Collection
iPad is a trademark of Apple Inc., registered in the U.S. and other countries.
Vernier EasyData,Vernier EasyLink and Vernier EasyTemp are registered trademarks of Vernier Science Education.
Vernier EasyData,Vernier EasyLink and Vernier EasyTemp are registered trademarks of Vernier Science Education.