
German Tanks: Exploring Sampling Distributions
Math: Statistics: Sampling Distributions
9-12
45 Minutes
TI-Nspire™ CX CAS
TI-Nspire™ CX
TI-Nspire™ CX
TI-Nspire™ CX series
TI-Nspire™ CX CAS/CX II CAS
5.0
Lessons
TNS
German Tanks: Exploring Sampling Distributions
Activity Overview
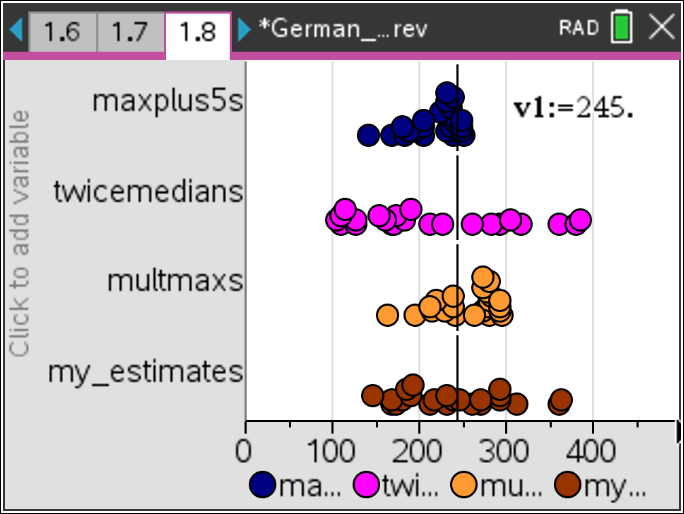
In this lesson, students will estimate the largest number of a population based on random samples from the population, as statisticians did in WWII.
Objectives
- Students will be able to interpret variability in the sampling distribution of a sample statistic.
- Students will evaluate the usefulness of a statistic by studying its sampling distribution.
- Students will be able to identify a biased estimator that results in predominantly over or under estimates of the population parameter.
Vocabulary
- bias
- dotplot
- mean
- median
- maximum
- minimum
- parameter
- statistic
- variability
About the Lesson
This lesson involves estimating the largest value from a population of consecutive numbers starting at 1.
As a result, students will:
- Create rules to estimate the largest number of a population based on random samples from the population.
- Analyze rules using graphs of the sampling distributions of a sample statistic.
- Analyze rules to determine an estimate of the largest value from a population.
Download Files
Math: Statistics: Sampling Distributions
9-12
45 Minutes
TI-Nspire™ CX CAS
TI-Nspire™ CX
TI-Nspire™ CX
TI-Nspire™ CX series
TI-Nspire™ CX CAS/CX II CAS
5.0
Lessons
TNS
iPad is a trademark of Apple Inc., registered in the U.S. and other countries.
Vernier EasyData,Vernier EasyLink and Vernier EasyTemp are registered trademarks of Vernier Science Education.
Vernier EasyData,Vernier EasyLink and Vernier EasyTemp are registered trademarks of Vernier Science Education.