
Exploring the Normal Curve Family
Math: Statistics: Normal Distributions
9-12
45 Minutes
TI-Nspire™ CX series
TI-Nspire™ CX CAS/CX II CAS
3.0
Lessons
TNS
Exploring the Normal Curve Family
Activity Overview
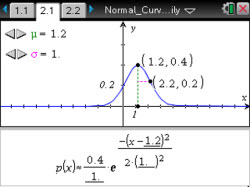
Students will investigate the relationship of the equation of a normal curve to its graph. They will use a slider to change the values of two parameters, m and s, to investigate their effects on the normal curve, noting in particular that m represents the location of the mean and that s represents the distance from the mean to the curve at the point of inflection.
Objectives
- Students will identify the three defining characteristics of a normal curve related to shape, center, spread, and area.
- Students will recognize that normal curves form a family whose members share these same characteristics.
- Students will use appropriate tools strategically (CCSS Mathematical Practices).
- Students will model with mathematics (CCSS Mathematical Practices).
Vocabulary
- normal curve
- mean
- standard deviation
- point of inflection
- density functions
About the Lesson
This lesson involves investigating the relationship of the equation of a normal curve to its graph.
As a result, students will:
- Identify the axis of symmetry as the line x =, the mean of the distribution represented by the normal curve, and the standard deviation as the distance from that line to the point of inflection.
- They will use a slider to change the values of two parameters, m and s to investigate their effects on the normal curve, noting in particular that m represents the location of the mean and that s represents the distance from the mean to the curve at the point of inflection.
- Estimate the area under a normal curve graphed on a coordinate grid and investigate how this area changes as the mean and standard deviation are changed.c
Math: Statistics: Normal Distributions
9-12
45 Minutes
TI-Nspire™ CX series
TI-Nspire™ CX CAS/CX II CAS
3.0
Lessons
TNS
iPad is a trademark of Apple Inc., registered in the U.S. and other countries.
Vernier EasyData,Vernier EasyLink and Vernier EasyTemp are registered trademarks of Vernier Science Education.
Vernier EasyData,Vernier EasyLink and Vernier EasyTemp are registered trademarks of Vernier Science Education.