
Applications of Parabolas
Math: Algebra I: Quadratic Functions
9-12
20 Minutes
TI-Nspire™ CX series
1.7
Lessons
TNS
Applications of Parabolas
Activity Overview
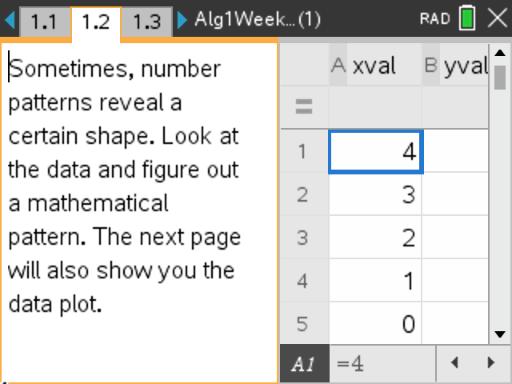
In this activity, students will look for both number patterns and visual shapes that go along with quadratic relationships. Two applications are introduced after some basic patterns in the first two problems.
Download Files
Teacher Files
Student Files
Math: Algebra I: Quadratic Functions
9-12
20 Minutes
TI-Nspire™ CX series
1.7
Lessons
TNS
iPad is a trademark of Apple Inc., registered in the U.S. and other countries.
Vernier EasyData,Vernier EasyLink and Vernier EasyTemp are registered trademarks of Vernier Science Education.
Vernier EasyData,Vernier EasyLink and Vernier EasyTemp are registered trademarks of Vernier Science Education.