
Chirp, Jump, Scatter
Math: Algebra I: Data Analysis
Math: Algebra I: Linear Functions
9-12
15 Minutes
TI-Nspire™ CX series
TI-Nspire™ CX CAS/CX II CAS
3.0
Lessons
TNS
Chirp, Jump, Scatter
Activity Overview
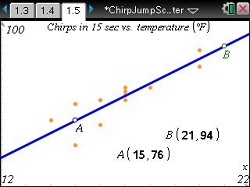
In this activity, students will find a best fit line for data graphed as scatter plots. Applications of linear relationships provide motivation for students and improve their skills and understanding of finding the equation of a line from two known points. Movable lines make this activity approachable for Algebra 1 students. Students can put into practice what they have learned with extension/homework questions.
Download Files
Teacher Files
Student Files
Math: Algebra I: Data Analysis
Math: Algebra I: Linear Functions
9-12
15 Minutes
TI-Nspire™ CX series
TI-Nspire™ CX CAS/CX II CAS
3.0
Lessons
TNS
iPad is a trademark of Apple Inc., registered in the U.S. and other countries.
Vernier EasyData,Vernier EasyLink and Vernier EasyTemp are registered trademarks of Vernier Science Education.
Vernier EasyData,Vernier EasyLink and Vernier EasyTemp are registered trademarks of Vernier Science Education.