
Density Curves
Math: Statistics: Data Analysis
9-12
15 Minutes
TI-Nspire™ CX series
2.0
Lessons
TNS
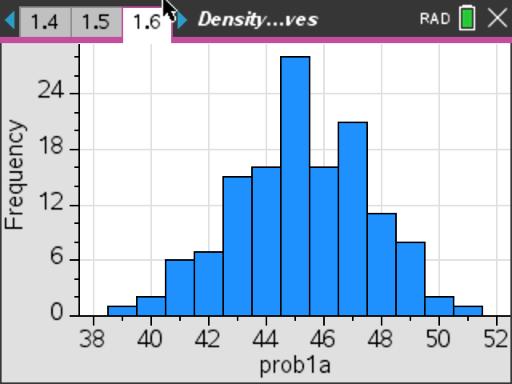
Density Curves
Activity Overview
Students will be introduced to density curves as a simple analysis of a data set. They also will investigate where the median and mean lie on symmetric or skewed graphs.
Download Files
Teacher Files
Student Files
Math: Statistics: Data Analysis
9-12
15 Minutes
TI-Nspire™ CX series
2.0
Lessons
TNS
iPad is a trademark of Apple Inc., registered in the U.S. and other countries.
Vernier EasyData,Vernier EasyLink and Vernier EasyTemp are registered trademarks of Vernier Science Education.
Vernier EasyData,Vernier EasyLink and Vernier EasyTemp are registered trademarks of Vernier Science Education.