
The River of Life
Science: Biology: Mammalian Physiology
9-12
60 Minutes
TI-84 series
This is Activity 11 from the EXPLORATIONS Book: Biology with the TI-83 Plus.
Lessons
The River of Life
Activity Overview
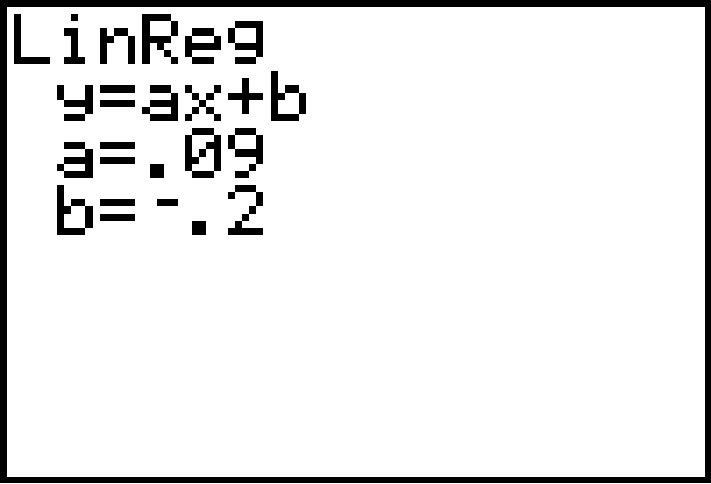
In this activity, students compare human body mass with blood volume. They graph the data and build a regression model. They estimate their own blood volume and also predict volumes of blood for other animals.
Science: Biology: Mammalian Physiology
9-12
60 Minutes
TI-84 series
This is Activity 11 from the EXPLORATIONS Book: Biology with the TI-83 Plus.
Lessons
iPad is a trademark of Apple Inc., registered in the U.S. and other countries.
Vernier EasyData,Vernier EasyLink and Vernier EasyTemp are registered trademarks of Vernier Science Education.
Vernier EasyData,Vernier EasyLink and Vernier EasyTemp are registered trademarks of Vernier Science Education.