
Transforming Bivariate Data
Math: Statistics: Describing Bivariate Data
9-12
50 Minutes
TI-Nspire™ CX series
TI-Nspire™ CX CAS/CX II CAS
3.0
Lessons
TNS
Transforming Bivariate Data
Activity Overview
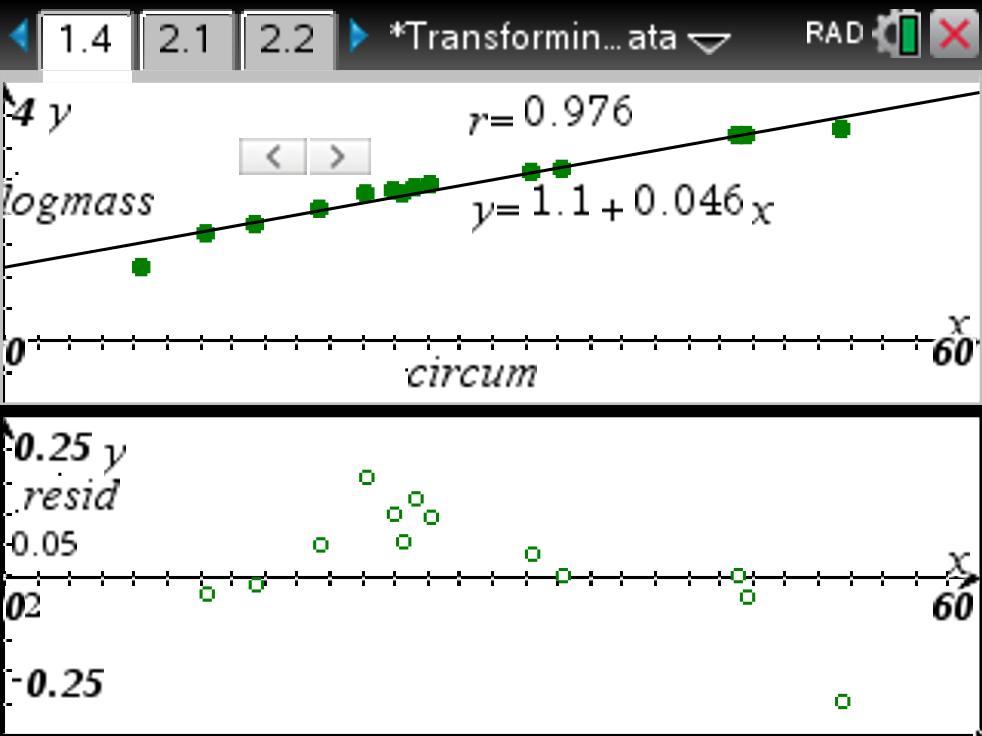
This lesson involves square root, semi-log, and log-log transformations of curved bivariate data using given data sets.
Objectives
- Students will recognize that bivariate data can be transformed to reduce the curvature in the graph of a relationship between two variables.
- Students will use scatterplots, residual plots, and correlation coefficients of different transformations of bivariate data to determine which transformation is more effective at eliminating the curvature.
- Students will make predictions about the response variable using a transformed data model.
Vocabulary
- bivariate data
- correlation coefficient
- exponential function
- least-squares regression line
- log transformation
- log-log transformation
- power function
- quadratic function
- residual plot
- scatterplot
- square root transformation
About the Lesson
This lesson involves square root, semi-log, and log-log transformations of curved bivariate data using given data sets.
As a result, students will:
- Observe scatterplots, residual plots, and correlation coefficients of bivariate data.
- Transform data using square root, semi-log, and log-log transformations.
- Determine which transformation is more effective at reducing the curvature in the graph of two variables.
- Use the least-squares regression line based on the transformed data to make predictions.
Download Files
Math: Statistics: Describing Bivariate Data
9-12
50 Minutes
TI-Nspire™ CX series
TI-Nspire™ CX CAS/CX II CAS
3.0
Lessons
TNS
iPad is a trademark of Apple Inc., registered in the U.S. and other countries.
Vernier EasyData,Vernier EasyLink and Vernier EasyTemp are registered trademarks of Vernier Science Education.
Vernier EasyData,Vernier EasyLink and Vernier EasyTemp are registered trademarks of Vernier Science Education.